Beating the House: How Underdogs Broke the Betting Market in the 2005/06 Premier League
Decoding why favorites fail and how underdogs consistently outperform expectations
Executive Summary
Objective: Evaluate whether betting odds reliably predict match outcomes.
Key Insight: Favorites failed to win in 41.8% of matches (159 out of 380).
Why it Happens: Home advantage, defensive discipline, and psychological pressure are underestimated by the market.
Recommendation: Avoid relying solely on odds; incorporate venue and resilience indicators into decision-making.
Audience: This analysis is written for analysts, bettors, and decision-makers
who rely on betting odds to assess match risk and expected outcomes.
380
Matches Analyzed
41.8%
Favorite Failure Rate
29
Max Underdog Points
Introduction
This section sets the context for why betting odds are widely trusted and why that assumption
needs closer examination.
In the high-stakes world of sports analytics, we are often told that the "house" always wins because their mathematical models are unbeatable. We assume that when a team is labeled a "Favorite," they are almost guaranteed to win. However, the 2005/06 Premier League season tells a different story. Much like famous historical upsets where the smaller side defeated the giant, this season shows that "experts" have a massive blind spot. By looking at the data from 380 matches, this report explores the "Efficiency Gap"—the space where favorites fail and underdogs thrive.
The Question:
Is the betting market actually reliable, or is there a systematic "Resilience Factor" in certain teams that the experts fail to see? We want to find out how often the favorites fail and which teams are the best at "Giant Slaying."
The Macro View: When Favorites Fall
This section measures how often betting favorites fail across the season and establishes
the scale of the market’s prediction error.
Our first discovery is that the market is far less predictable than people think. While bookmakers use complex formulas to set their odds, the predicted favorite failed to win in 41.8% of matches (159 out of 380 games). This means that in nearly 4 out of 10 games, the "safe bet" was wrong. This "Volatility Zone" is where mid-table teams make their mark.
Figure 1: Market Reliability showing the 41.8% rate at which favorites failed to win.
This pattern raises an important question: if favorites fail so often, what exactly do
underdog teams do differently? To answer this, we compare how favorites and underdogs
accumulate points over a season and identify the key factors that separate their
performance.
To move beyond surface-level upsets, the next section compares how favorites and underdogs
generate points over a full season. This reveals the structural differences that betting
markets tend to overlook.
Key Insight:
Nearly 4 out of 10 matches fall into a volatility zone where the betting favorite does not win,
suggesting that market confidence frequently overestimates match certainty.
Why Underdogs Outperform Expectations: The Key Differences from Favorites
This section explains why underdogs consistently outperform market expectations by
comparing how favorites and underdogs accumulate points across a season.
The repeated failure of favorites is not driven by random upsets or isolated performances.
A closer comparison between favorites and underdogs reveals clear differences in how these
teams generate value over a season. These differences represent the core factors that
separate underdogs from favorites in the betting market.
Differential Factor 1: Home Advantage Has a Disproportionate Impact on Underdogs
While home advantage exists for all teams, its impact is significantly stronger for
underdogs than for favorites. Underdogs earn a much larger share of their total points
when playing at home, whereas favorites show relatively stable performance regardless of
venue.
This suggests that contextual factors such as crowd support, reduced pressure, and familiar
playing conditions disproportionately benefit underdogs. These effects are often
underestimated in betting models, creating opportunities for underdog teams to outperform
expectations.
Differential Factor 2: Underdogs Accumulate Points by Avoiding Losses, Not by Winning
A second major difference lies in how points are accumulated. Favorites primarily justify
their odds through outright wins. Underdogs, however, generate a substantial portion of
their points through draws rather than victories.
Instead of attempting to dominate stronger opponents, successful underdogs focus on
defensive discipline and game management. In practice, refusing to lose
consistently proves more valuable than chasing unlikely wins.
These structural differences explain why certain teams are able to consistently outperform
market expectations. The next section highlights which clubs were most effective at
exploiting these factors during the 2005/06 season.
Combined Insight:
The performance gap between favorites and underdogs is driven by structure, not chance.
Underdogs gain disproportionate value from home advantage and consistently accumulate
points by avoiding losses rather than chasing wins. Together, these factors reveal a
repeatable strategy that betting markets systematically underestimate.
The Answer: Identifying the Giant Slayers
This section highlights the teams that most effectively exploited betting inefficiencies
and consistently outperformed expectations as underdogs.
This market error isn't random. Some teams are simply better at performing when the pressure is off and they are expected to lose. Our data identifies West Ham United as the ultimate disruptor, earning a league-high 29 points as an underdog. They were followed closely by Middlesbrough (28) and Wigan (28).
Figure 2: Points earned specifically as an Underdog. West Ham leads the league in surprise value.
Interestingly, the data shows that the biggest teams like Arsenal and Chelsea earned 0 points as underdogs. Because they were favorites in every game, they never had the chance to "upset" anyone. On the other hand, smaller teams like West Brom relied on these surprises for over 75% of their season success. This proves that for smaller clubs, "beating the house" isn't just luck—it’s a survival strategy.
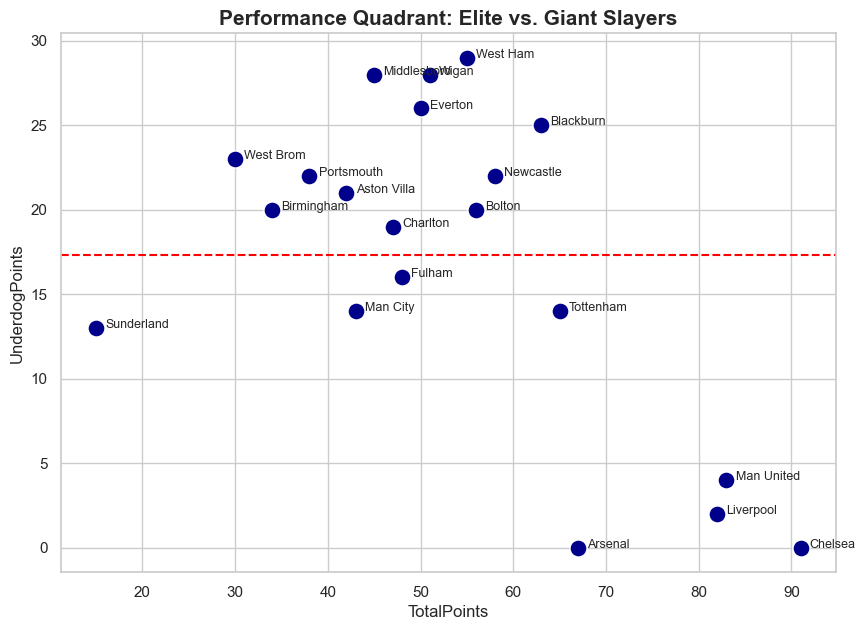
Figure 3: Skill vs. Surprise. Mapping consistent giants against scrappy disruptors.
Top-left quadrant represents high underdog impact with lower total points — the true "Giant Slayers."
Pattern Observed:
Underdog success is not evenly distributed across the league. A small group of teams
repeatedly exploit market inefficiencies, suggesting that underdog performance
is driven by repeatable behavior rather than random upsets.
The Tactics: The Underdog Home Advantage
This section translates analytical insights into on-field tactics, showing how underdogs
convert structural advantages into repeatable match outcomes.
Why does the market fail so consistently? One of the biggest reasons is the Home Factor. Our data shows two critical points about geography:
- The 12th Man Effect: Underdogs are 40% more effective when playing in their own stadium.
- Venue Efficiency: Favorites drop points more frequently when traveling to mid-table stadiums.
Figure 4: Underdog points earned at Home vs. Away.
While total away points are higher due to more fixtures, points per match are significantly higher for home underdogs.
The Underdog Playbook: How Underdog Teams Win Matches
The data shows that underdog success is not driven by luck or one-off performances, but by
a repeatable and disciplined strategic approach. Rather than attempting to outplay stronger
teams, underdogs optimize for outcomes that the betting market tends to undervalue.
When to Play for the Draw:
- Facing Top 4 teams at home
- Limited attacking resources
- High crowd pressure environments
Expected Outcome: Higher season stability and improved survival probability.
Figure 5: Outcome Analysis showing that Draws are the underdog's most effective weapon.
Big Picture Takeaway:
Underdog teams succeed not by outperforming favorites, but by optimizing for outcomes
that the market consistently undervalues. This makes underdog success predictable
under the right conditions.
Business Recommendations & Action Plan
This final section converts analytical findings into practical recommendations and
documents how the analysis can be reproduced or extended.
1. Better Scouting:
Instead of only looking at stars in top teams, look for players in "Giant Slayer" clubs like West Ham.
2. Play for the Draw:
When smaller teams face elite opponents at home, a defensive draw is the most reliable strategy.
3. Expect the Unexpected:
With nearly a 40% prediction error rate, betting odds should never be used as a single decision input.
Methodology & Reproducibility
- Match-level data was cleaned and prepared using Python (Pandas).
- Favorites and underdogs were classified using pre-match betting odds.
- Team-level metrics were aggregated from individual match outcomes.
- Cleaned datasets were exported as CSV files and visualized using Plotly.
All results are fully reproducible using the accompanying Jupyter notebook and exported datasets.
Limitations
- Analysis is limited to a single Premier League season
- Betting odds are used as a proxy for market expectation
- No player-level or injury data included
Next Experiments: What We Would Test with One More Week
If one additional week were available, the following experiments would be conducted using
the existing match-level dataset to further validate and deepen the analysis.
-
Team Consistency Test:
Measure whether “Giant Slayer” teams consistently outperform expectations across the
season or whether underdog success is driven by a small number of outlier matches.
-
Venue-Adjusted Efficiency Metric:
Recalculate underdog performance as points per match separately for home and away
fixtures to quantify how much value is driven purely by venue effects.
-
Draw Probability Modeling:
Compare draw rates for underdogs versus favorites to formally test whether draws are
systematically undervalued by the betting market.
All experiments rely solely on existing match outcomes, odds, and venue information and can
be implemented without additional data collection.
Final Conclusion
This analysis shows that betting odds are far from perfect predictors of match outcomes.
During the 2005/06 Premier League season, favorites failed to win in nearly 42% of matches, highlighting a clear gap between market expectations and on-field reality.
The reason for this gap is not randomness.
Underdogs consistently outperform expectations because of two structural advantages that the market undervalues: home advantage and defensive resilience.
When playing at home, underdogs gain a disproportionate boost from crowd support and familiarity.
In addition, many successful underdog teams focus on avoiding losses rather than chasing unlikely wins, making draws a reliable and repeatable strategy.
Teams like West Ham demonstrate that this is not accidental.
Their success as underdogs reflects a deliberate approach rather than isolated upsets.
For smaller clubs, exploiting these inefficiencies is not a bonus—it is a survival strategy.
The key takeaway is simple: betting odds should be treated as a starting point, not a final answer.
Incorporating context such as venue and game strategy can significantly improve decision-making.
This insight applies not only to betting markets, but to any system that relies on simplified predictions in complex, real-world environments.